One material property that is widely used and recognized is the strength of a material. But what does the word "strength" mean? "Strength" can have many meanings, so let us take a closer look at what is meant by the strength of a material. We will look at a very easy experiment that provides lots of information about the strength or the mechanical behavior of a material, called the tensile test.
The basic idea of a tensile test is to place a sample of a material between two fixtures called "grips" which clamp the material. The material has known dimensions, like length and cross-sectional area. We then begin to apply weight to the material gripped at one end while the other end is fixed. We keep increasing the weight (often called the load or force) while at the same time measuring the change in length of the sample.
Let us discuss some of the important areas of the graph. First, the point on the graph labeled number 1 indicates the end of the elastic region of the curve. Up to this point, the material stretches in an elastic or reversible manner.
All materials are made up of a collection of atoms. Elasticity can be best understood by imaging the atoms are connected by springs. As we pull on the material, the springs between the atoms get longer and the material lengthens. The elastic portion of the curve is a straight line. A straight line indicates that the material will go back to its original shape when the load is removed.
Graph Location 2: 0.2% Offset Yield StrengthThe next portion of the curve of interest is point 2. At this point the curve has begun to bend over, or is no longer linear. This point is known as the 0.2% offset yield strength. It indicates the strength of the material just as it starts to permanently change shape. It is determined as the value of the stress at which a line of the same slope as the initial portion (elastic region) of the curve that is offset by a strain of 0.2% or a value of 0.002 strain intersects the curve.
In our example, the 0.2% offset yield strength is a 88 ksi.
This is a very important aspect of strength. It basically tells us the amount of stress we can apply before the material starts to permanently change shape, putting it on a path to eventual failure. Those who design parts that are used under stress must see that the stress or force on the part never exceeds this value.
Graph Location 3: Maximum Withstand-able Stress
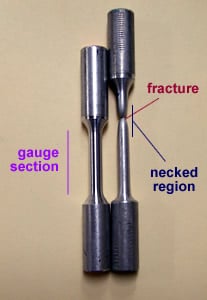
As we move up from point 2 the load or "stress" on the material increases until we reach a maximum applied stress, while the material deforms or changes shape uniformly along the entire gauge length. When we reach point 3, we can determine the tensile strength or maximum stress (or load) the material can support. It is not a very useful property, since the material has permanently deformed at this point. After we reach this point, the stress begins to curve drastically downward. This corresponds to localized deformation, which is observed by a noticeable “necking” or reduction in the diameter and corresponding cross-section of the sample within a very small region. If we release the load in this area, the material will spring back a little but will still suffer a permanent shape change.
Graph Location 4: Failure or Fracture
Finally, as we follow the curve we eventually reach a point where the material breaks or fails. Of interest here is the final degree to which the material changes shape. This is the “ductility” of the material. It is determined by the intersection of line number 4, having the same slope as the linear portion of the curve, with the strain axis.
Our example shows a strain of 0.15. The 15% change in length is the amount of “ductility”.
When the sample fractures or breaks the load is released. Therefore, the atoms elastically stretched will return to their non-loaded positions. Other information about the mechanical response of a material can also be gathered from a fracture test.
If one pulls on a material until it breaks, one can find out lots of information about the various strengths and mechanical behaviors of a material. In this virtual experiment we will examine the tensile behavior of three different composite fiber materials. They have similar uses but very different properties.

A material is gripped at both ends by an apparatus, which slowly pulls lengthwise on the piece until it fractures. The pulling force is called a load, which is plotted against the material length change, or displacement. The load is converted to a stress value and the displacement is converted to a strain value.
About the Materials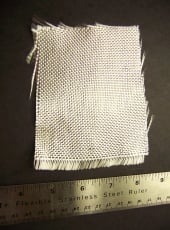
Testing materials are the composites fiberglass, Kevlar®, and carbon fiber. Composites are combinations of two or more individual materials with the goal of producing a material having unique properties not found in any single material.
All of these composites use epoxy as a matrix, which “glues” the fabric like arrangement of the fibers of the respective materials.
Epoxies are thermosetting network polymers, which are very hard and strong, but on the brittle side.
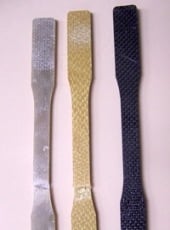
All fabrics are of the same “weight,” which is a measure of fabric size or weight of a square yard. An example of the fiber material made from fiberglass is shown above left. Kevlar is very similar except it has a yellow color. The carbon has a black color. The samples used in this case are flat bars cut out of larger material using a water jet saw. The three samples are shown below left.
Material Properties| Material Properties | Fiberglass | Kevlar® | Carbon Fiber |
|---|---|---|---|
| Density | P | E | E |
| Tensile Strength | F | G | E |
| Compressive Strength | G | P | E |
| Stiffness | F | G | F |
| Fatigue Resistance | G-E | E | G |
| Abrasion Resistance | F | E | F |
| Sanding/Machining | E | P | E |
| Conductivity | P | P | E |
| Heat Resistance | E | F | E |
| Moisture Resistance | G | F | G |
| Resin Compatibility | E | F | E |
| Cost | E | F | P |
P=Poor, G=Good, F=Fair, E=Excellent